


Crap, at this point, who knows? To my thinking there is a gap between market fundamentals and Wall Street rhetoric. That is being caused by Big Red in the far east and commodity pricing free-fall, especially oil. Read a tidbit today from a daily email that I get saying that current gas prices are worth a $400 million tax cut, which is good for the overall economy in terms of consumer purchasing power. The volatility has pretty much stayed in a tight range between 17,000 and 18,000 on the Dow and 2,000 and 2,400 on the S&P. However, it is tough to play the up and down game in such a tight band. That is opposed to a real market correction that falls above bear territory and then steady increases to new highs, adjusted by profit taking. This past summer, I made a couple of energy plays when the issues were 40% off 52 week highs. Unfortunately those plays are now about 45% below my discounted purchase price. I am in the process of deciding when/if to double down, or cut losses. All this to say, who the hell knows!
Results 101 to 110 of 456
Thread: Stock Market Predictions
-
01-07-2016, 04:27 PM #101Junior


- Join Date
- Jan 2008
- Posts
- 4,515
Pray the Rosary daily
-
01-07-2016, 04:31 PM #102Supporting Member
- Join Date
- Apr 2009
- Location
- South Carolina
- Posts
- 20,307
Bring $.25/gallon gas prices!
(yes, I know there are only 3 people on this board that actually remember those)...he went up late, and I was already up there.
-
01-07-2016, 04:47 PM #103Supporting Member
- Join Date
- Nov 2008
- Location
- Colorado
- Posts
- 11,485
I remember filling up my VW Bug for 2 bucks! Price Wars!
2023 Sweet 16
-
01-07-2016, 05:10 PM #104Junior
- Join Date
- Jan 2008
- Posts
- 4,515
I think maybe I'll head over to the Powerball thread. Heard today that the odds of winning are 1 in 292 million. Seems like better odds than making money in the investment markets.
Pray the Rosary daily
-
01-15-2016, 09:55 AM #105Supporting Member

- Join Date
- Jan 2008
- Location
- Wichita, KS
- Posts
- 34,394
The sky is falling!!!!!!
-
01-15-2016, 10:46 AM #106Supporting Member
- Join Date
- Jan 2008
- Posts
- 1,743
FWIW, here is a chart that uses the single-highest correlative valuation measure their organization has found for forecasting 12-year returns for the S&P 500. As you can see (based on the current position of the blue line), going into January of this year, 12-year returns were expected to be near zero. That's right. Zero returns for nearly 12 years. They've sampled many other highly-correlative measures as well--all showing similar results.
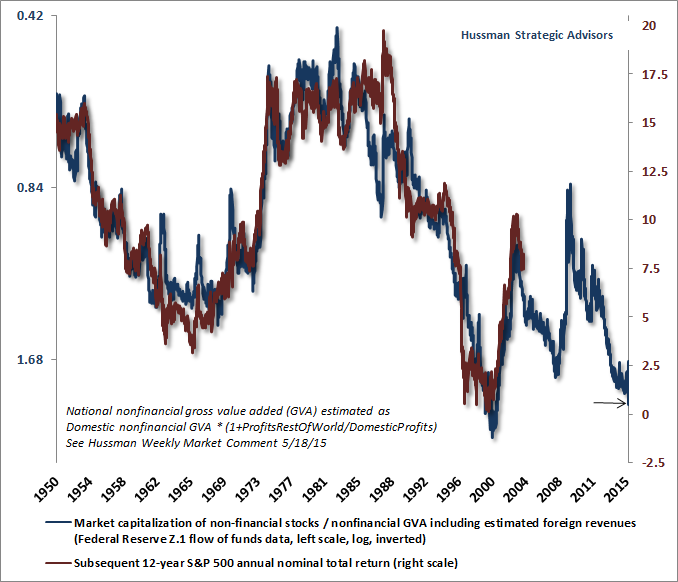
Why is the market (and markets everywhere) so overvalued? Because nearly all of the central banks around the world have FLOODED their economies with excess currency while artificially driving down interest rates to near-zero.
Want to see evidence of that? The charts below comes from the Federal Reserve of St. Louis.
The first chart shows the United States total monetary base from 1998 through mid-2002. I chose these dates because they capture Y2K and 9/11. Why are those dates important? Because, if you recall, the big financial headlines during those two events screamed how the Fed had "flooded" the markets with cash to avoid any panic or ripple effects throughout the economy.
The two peaks on the chart show the Fed's efforts in "flooding" the markets with money and providing the necessary cash cushion to absorb the shock or potential shock of those events to our financial markets.
click on chart to expand:FRED Capture 1.jpg
The next chart shows the Fed's efforts (primarily QE1, QE2 and QE3) in FLOODING the markets with cash since the 2008/09 financial crisis. Note that I started the chart just before 2000 so you compare the now virtually indistinguishable blips from what the Fed used to consider "flooding" the markets with money.
click on chart to expand:FRED Capture 2.jpg
As you can see, the Fed has essentially QUINTUPLED our money supply over the previous 6+ years. That is unprecedented!
And, they've kept rates at near-zero throughout those years, essentially penalizing anyone who saves while encouraging speculation and a reckless pursuit of yield. We're now entering nearly two decades of a bubble era (from roughly 1998), brought on largely by our Fed (primarily Greenspan and Bernanke). Their moves punish those who make prudent decisions and reward those who do not--at least temporarily.
I would be surprised if we don't see the 1200s or possibly 1100s for the S&P 500, knowing that only takes us to typical, normalized valuations.
GEEK NOTE: If you like tinkering with interactive stat tools, here's a link to the Interactive St. Louis Fed Monetary Base Charting Tool[/URL] I used to create the last two charts above: https://research.stlouisfed.org/fred2/series/BOGMBASE. There are many different data series you can visualize on the site besides monetary base."Xavier is Franciscan monkspeak for gonads."
- Gregg Doyel on Twitter
-
01-15-2016, 11:03 AM #107I still believe.
- Join Date
- Feb 2008
- Posts
- 4,830
This is so much more than a college basketball discussion forum.
We've come a long way since my bench seat at the Fieldhouse!
-
01-15-2016, 08:32 PM #108Junior
- Join Date
- Jan 2008
- Posts
- 4,515
It's pretty much a dumpster fire at this point.
Pray the Rosary daily
-
01-15-2016, 09:17 PM #109Supporting Member
- Join Date
- Sep 2013
- Location
- Atlanta
- Posts
- 12,223
I remember my older sister (by 8 years) panicking that we were going to run out of gas in her first car, a little Fiat. We pulled into a gas station and she found a quarter under the seat, and we we good to go for the night! Originally Posted by bobbiemcgee

-
01-18-2016, 10:45 AM #110Supporting Member
- Join Date
- Jan 2008
- Posts
- 1,743
Given the S&P 500's intraday bounce Friday to move back above the August lows, that support level should hold for the near-term. If/when it breaks and doesn't bounce back, I'd be surprised if the next trip down doesn't take us into somewhere around the mid to low 1600s from a technical analysis perspective. There's a decent-sized head and shoulders pattern with the left shoulder dating back to May, 2014.
From a quantative perspective, John Hussman posted this chart over the weekend showing that EVERY time Industrial Production (IP) slowed for at least 8 of the previous 12 months since 1919, there has been a recession. That signal is 17 for 17 in signaling a recession (NOTE: recessions starts and ends are often backdated by the NBER--the official committee that and are not simply two or more consecutive quarters of GDP decline)
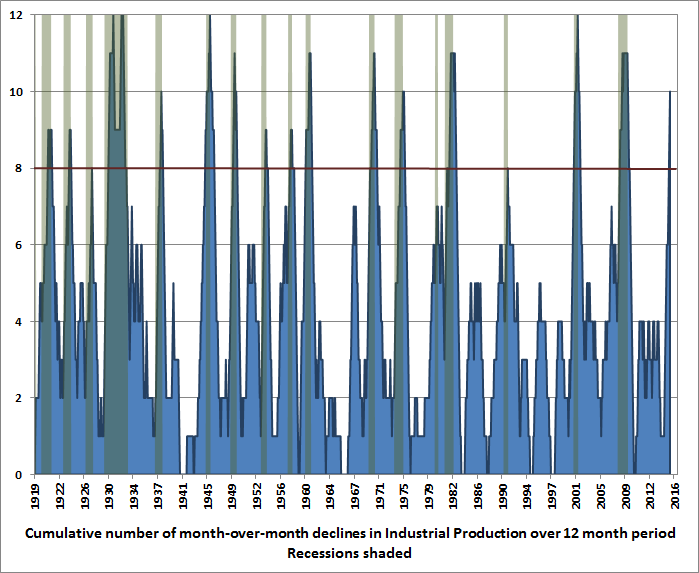
The most recent data shows that IP has slowed for 10 of the previous 12 months. So unless this time is different, the odds of a recession are overwhelming. In fact, the odds are very good that it will be backdated to the current quarter (Q1-16), if not earlier."Xavier is Franciscan monkspeak for gonads."
- Gregg Doyel on Twitter

 Reply With Quote


Bookmarks